Case study · Lia Hanson Hair · 2022–2026
I grew a solo hair business from ~$15.5K to ~$115K a year — about 7.4x — building the brand, the ads, and the software behind it.
Four years of end-to-end ownership for one client: I designed the logo and brand, built the website, engineered the booking experience, produced and ran the Meta video ads, and built her a personal dashboard app with full tracking. Branding lifted it first; ads compounded it — with weddings, the side I market hardest, up ~13x.
Spend is the total ad budget I managed since the Dec 2023 launch ($16,173). Impressions, CTR, CPC and leads are pulled live from the Meta Ads API for the granular tracking window · Jun 2024 – Jun 2026 (granular tracking window) ($14,123 of that spend). Benchmarks: WordStream & Triple Whale, 2025 Facebook Ads benchmarks.
Why this maps to the Brand Designer role
Every line of the brief, evidenced by real work on this account.
| Brand design & consistent visual language | Designed Lia’s entire brand system — emails, website, quote/invoice surfaces & comms (Figma + Illustrator). |
| DTC & awareness creative, digital ads | 23 ad creatives produced; 4.5% lifetime CTR (~3.9× the 1.16% beauty benchmark); $0.50 CPC vs ~$3 beauty average. |
| Landing pages for the DTC funnel | Built landing pages + WordPress site feeding the enquiry funnel — 6,414 landing-page views. |
| Organic growth, SEO & reputation | Built Lia’s Google Business Profile from zero, wrote SEO site copy + blog posts; 90 five-star Google reviews and 164 on Fresha. |
| Short-form video, gifs, micro-animations | Every Meta ad was a video creative I made; 280k+ video plays across the account. |
| Campaign assets & launch toolkits | Email journeys, seasonal offers, win-back campaigns across 38 templates. |
| AI-assisted creative workflows | Built Lia a personal dashboard app solo with AI — now adding AI agents that read the data and surface insights to optimise the next campaign. |
| Measurable outcomes | Wedding revenue ~13× (to $67K); whole business ~7× over four years to ~$115K, targeting $150K. |
The timeline
What I did, when — and how it moved the business
Four years, one compounding system. Brand earned trust, booking captured it, ads scaled it, and the dashboard now optimises it. Revenue shown is the confirmed all-up total at each step.
Built the brand and the organic foundation — logo, site, Google profile and reviews — and began shifting the focus from the chair toward bridal. Weddings reached $5K; total near $15.5K — the launchpad for what came next.
Paid acquisition begins — and revenue nearly triples to $43K (+178%) on top of the organic base.
Ads compound and the team scales — $103K, with weddings surging to $57K and salon to $47K.
Now data-driven — $115K and on track for the $150K goal.
The outcome · whole business
Total business revenue Confirmed actuals Fresha data
$15.5K all up in FY22–23, to $115,303 this past year — about 7.4x in four years. Branding rebuilt the foundation first (the brand, Google profile and reviews — before a dollar of scaled ads); paid ads from 2024 then compounded it — total +178% the first year they scaled. On track for the $150K goal.
All-up revenue — weddings + salon
WeddingsSalon (Fresha)· dashed = $150K goal
Two revenue engines · marketed differently
Weddings & salon — a separate strategy for each Confirmed actuals Fresha data
I market the two streams differently — bridal-party video creative for weddings, an offer-led approach for in-chair salon work. Weddings grew from $5K to $67K (~13x since FY22–23); salon grew $10K → $48K (~4.6x), climbing every year. The early climb came from brand work alone — paid ads, which I ran from 2024, then compounded it.
Wedding revenue — the climb since 2022
Solid bars = scaled-ads years (from 2024).
Salon revenue — Fresha
Sold through Fresha — steady growth from $10K to ~$48K, up every year.
How I do it
An infinite loop: create ⟷ learn
Every campaign runs as a loop, not a launch. The left side is making — turning Lia’s real work into tasteful video for the bride who wants nothing less than perfect; the right side is learning — testing variants, A/B-ing hooks, and reading what actually converts (load speed, search, tracking clarity). Each insight crosses straight back into the next creative, so every cycle is sharper than the last — all anchored by a core of expertise and trust.
Start from real imagery & video of Lia’s work — authentic moments on real brides, captured for marketing.
Turn it into tasteful ad creative for the bride who wants nothing less than perfect for her day.
Define the ideal customer — the perfectionist bride — and put the work in front of exactly her.
Run variants and A/B test hooks, angles and formats — let the audience vote on what lands.
Sharpen tracking clarity, load speed and searchability; read what people want to see more of.
Feed every insight into the next creative — so each turn of the wheel performs better than the last.
Performance marketing
Scaling spend while keeping clicks cheap
Monthly ad spend grew from $250 to $1,000+ as the creative proved out — and cost per click actually fell to ~$0.24 as the video creative got stronger.
Monthly spend vs leads captured
Bars: ad spend (AUD). Line: website leads. Source: Meta Ads API.
Click-through rate vs industry benchmarks
Lower dashed line = 1.16% Beauty & Personal Care avg · upper = 1.71% all-industry avg. Every month clears both.
Spend & leads by year
Granular tracking by calendar year (2024 & 2026 partial) — $14.1k. The Dec 2023 launch predates it; total managed spend is $16.2k.
173 leads in the first half of 2026 already exceed all of 2025 (156) — the system is compounding.
Return on ad spend
About $7 back for every $1 spent Provisional
Before the dashboard automated it, I hand-tracked ROAS month by month. Across Jun 2024 – Oct 2025, ~$7.1k of ad spend returned ~$50k in bookings — a blended 7x return, climbing from 5.8x in 2024 to 7.7x in 2025.
Monthly revenue returned vs ad spend
Dark = booking revenue attributed to ads · light = ad spend. Source: manual tracking sheet (V1).
Tracking stops Oct 2025, when the dashboard took over. Marked provisional: returns are hand-attributed and being reconciled against booked revenue.
The creative
Ad creatives — every one designed & produced by me
23 creatives across the account; 16 were video, driving 279,636+ video plays. Each one shot, edited and named by me — a mix of lead-drivers and high-engagement awareness cuts. Performance is real, pulled per-ad from Meta.
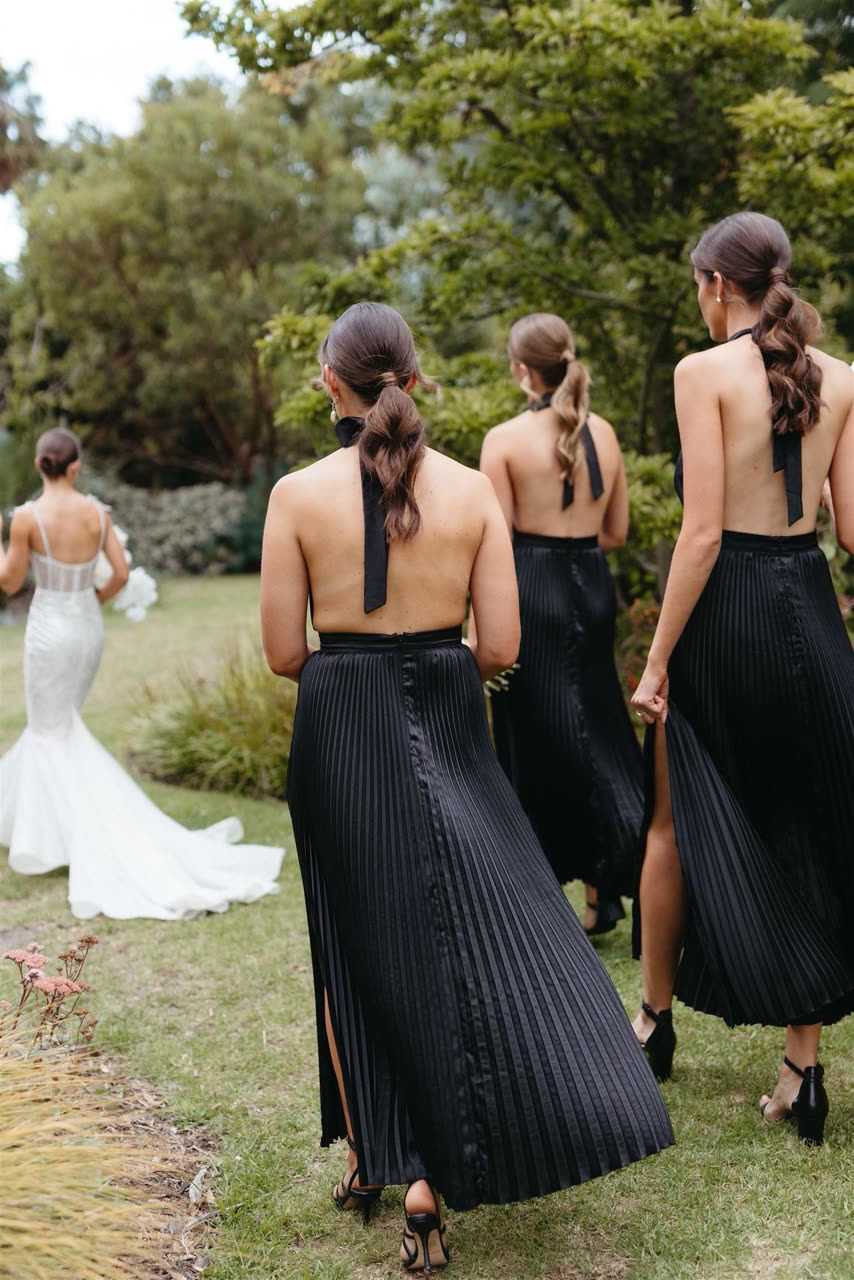
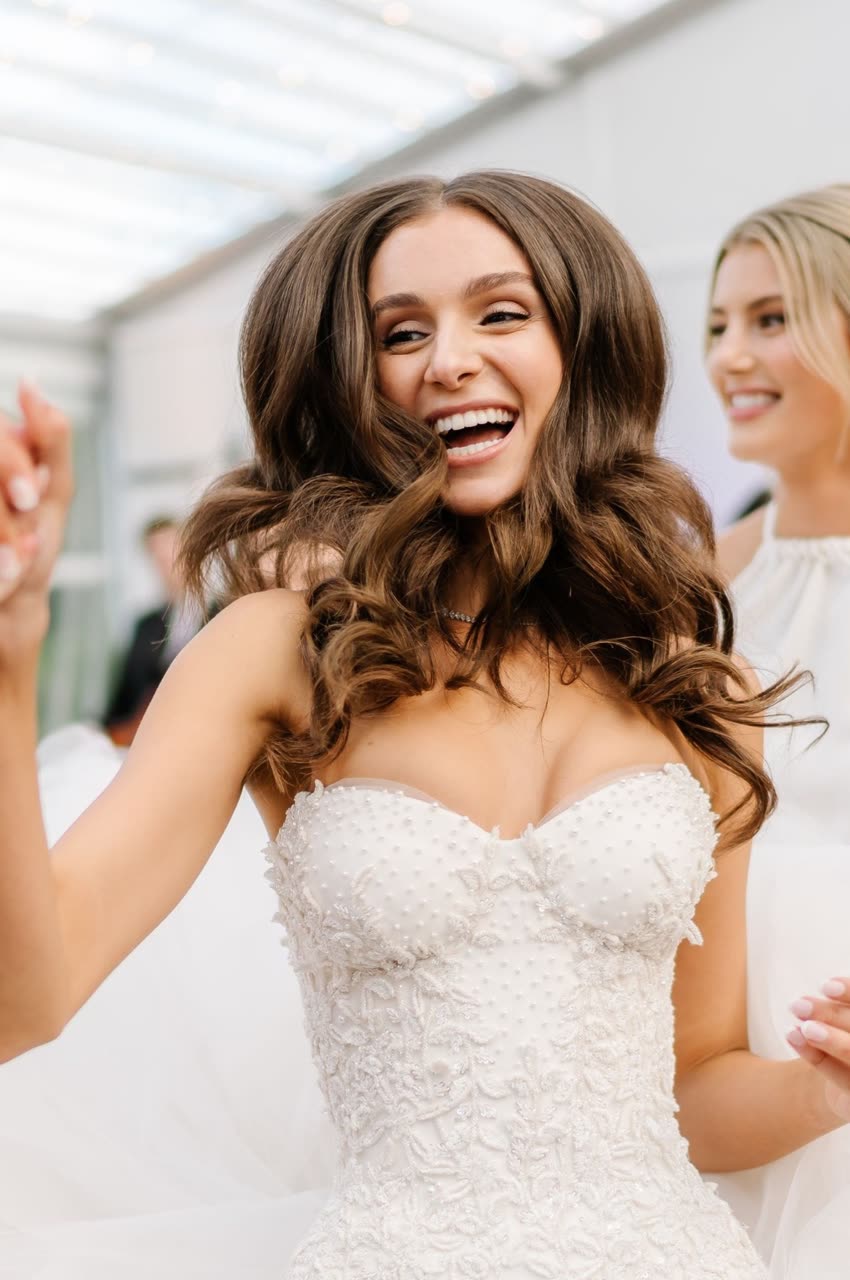
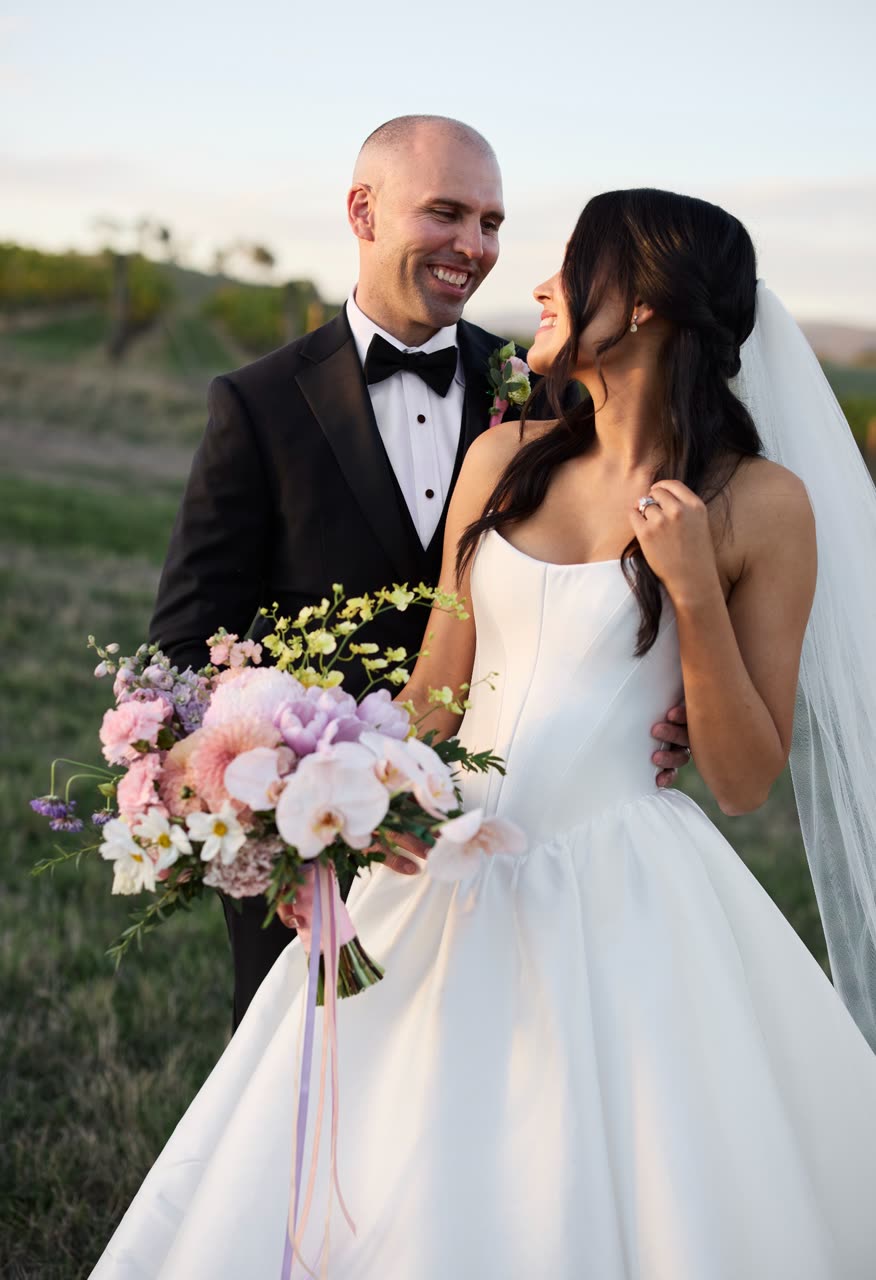
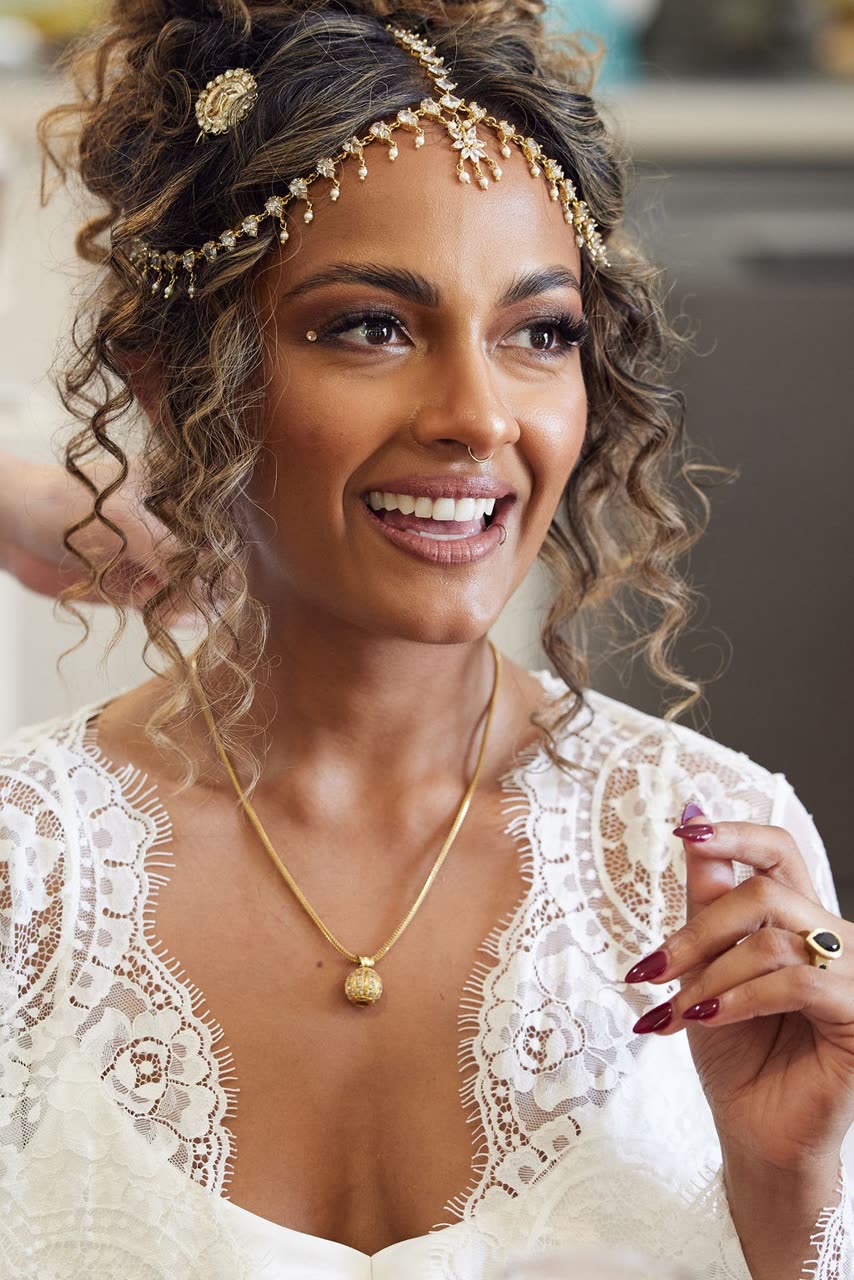
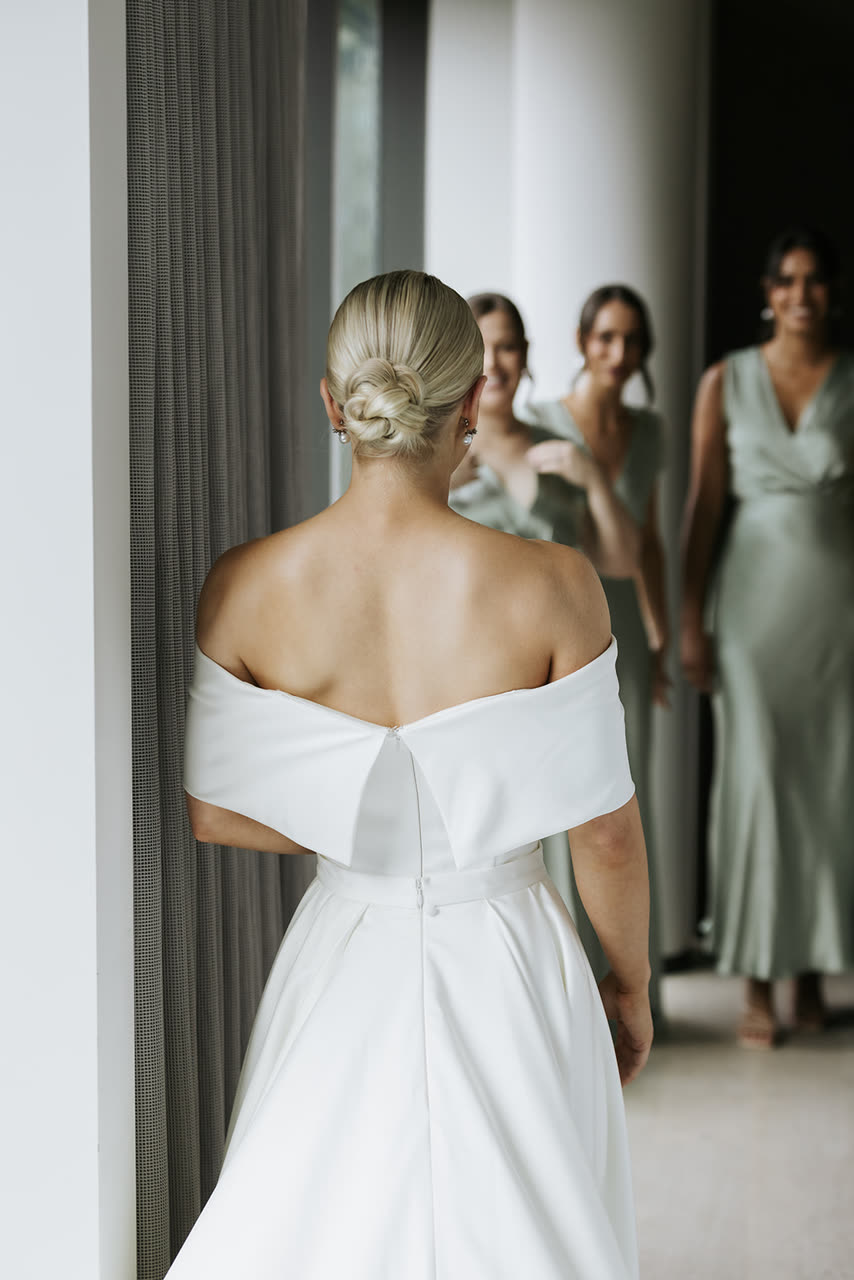
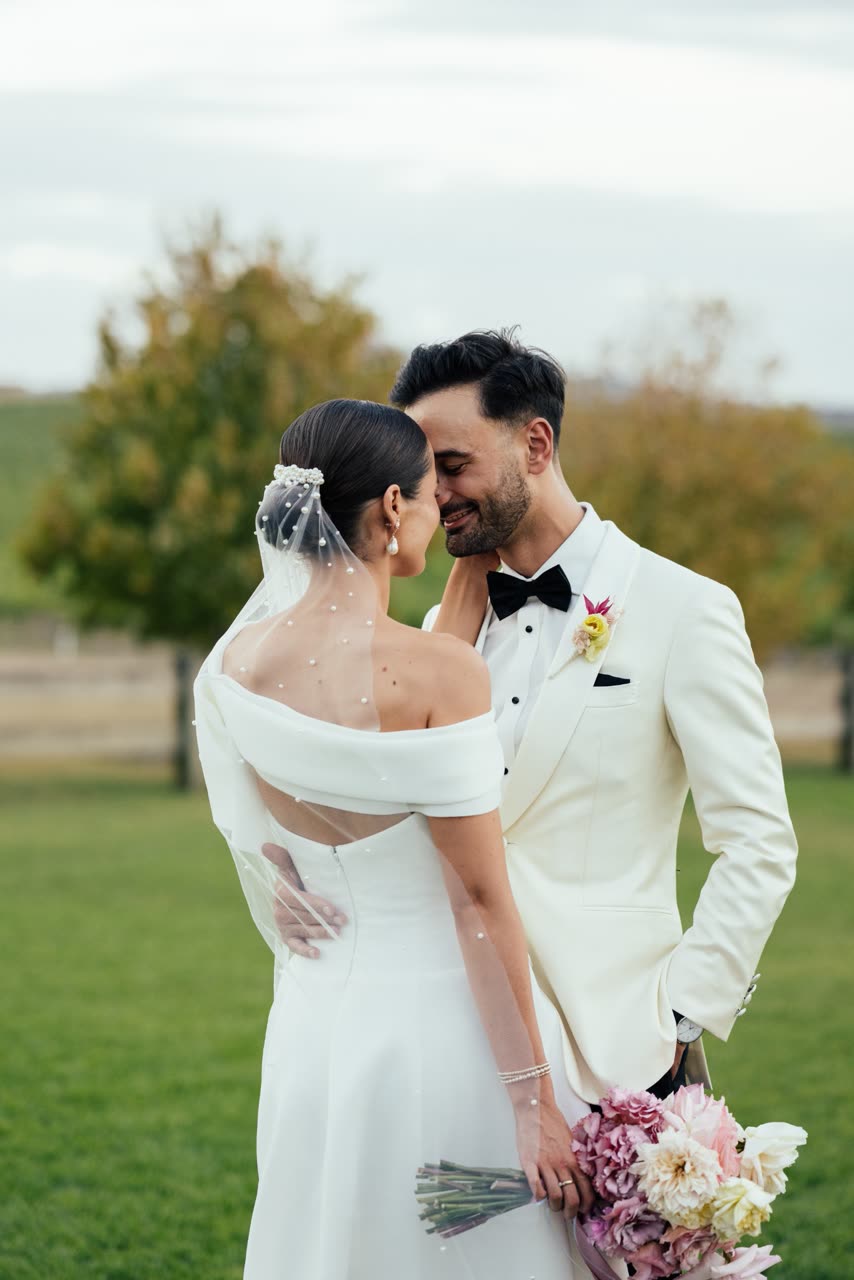
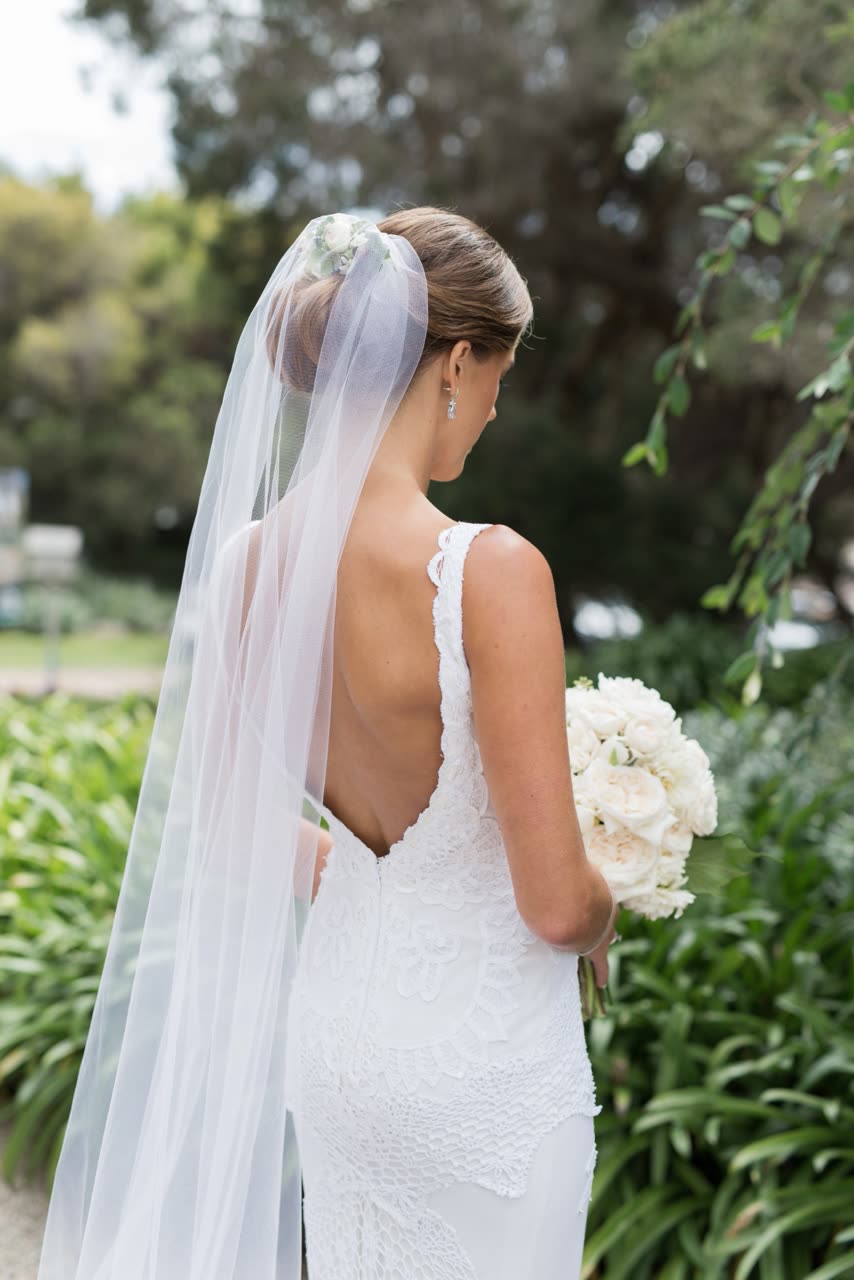
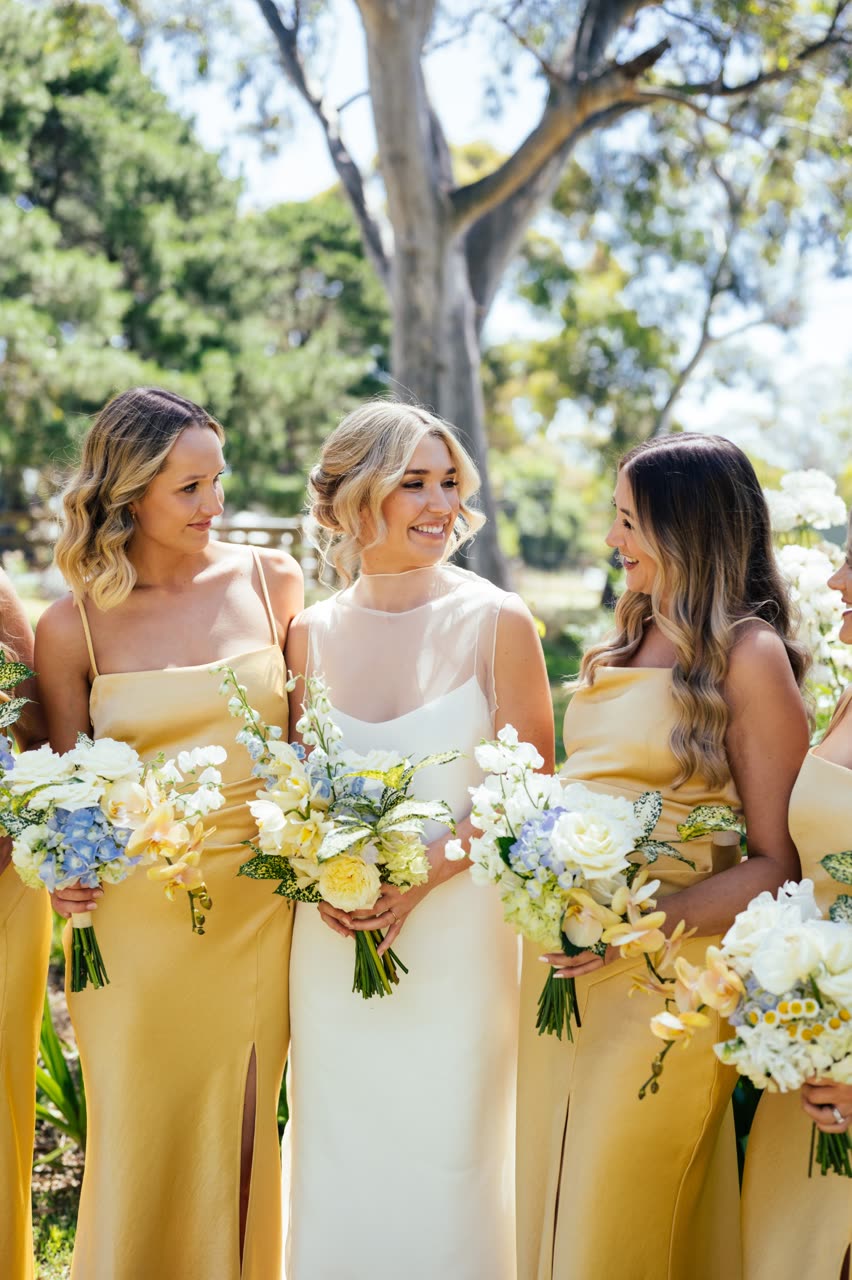
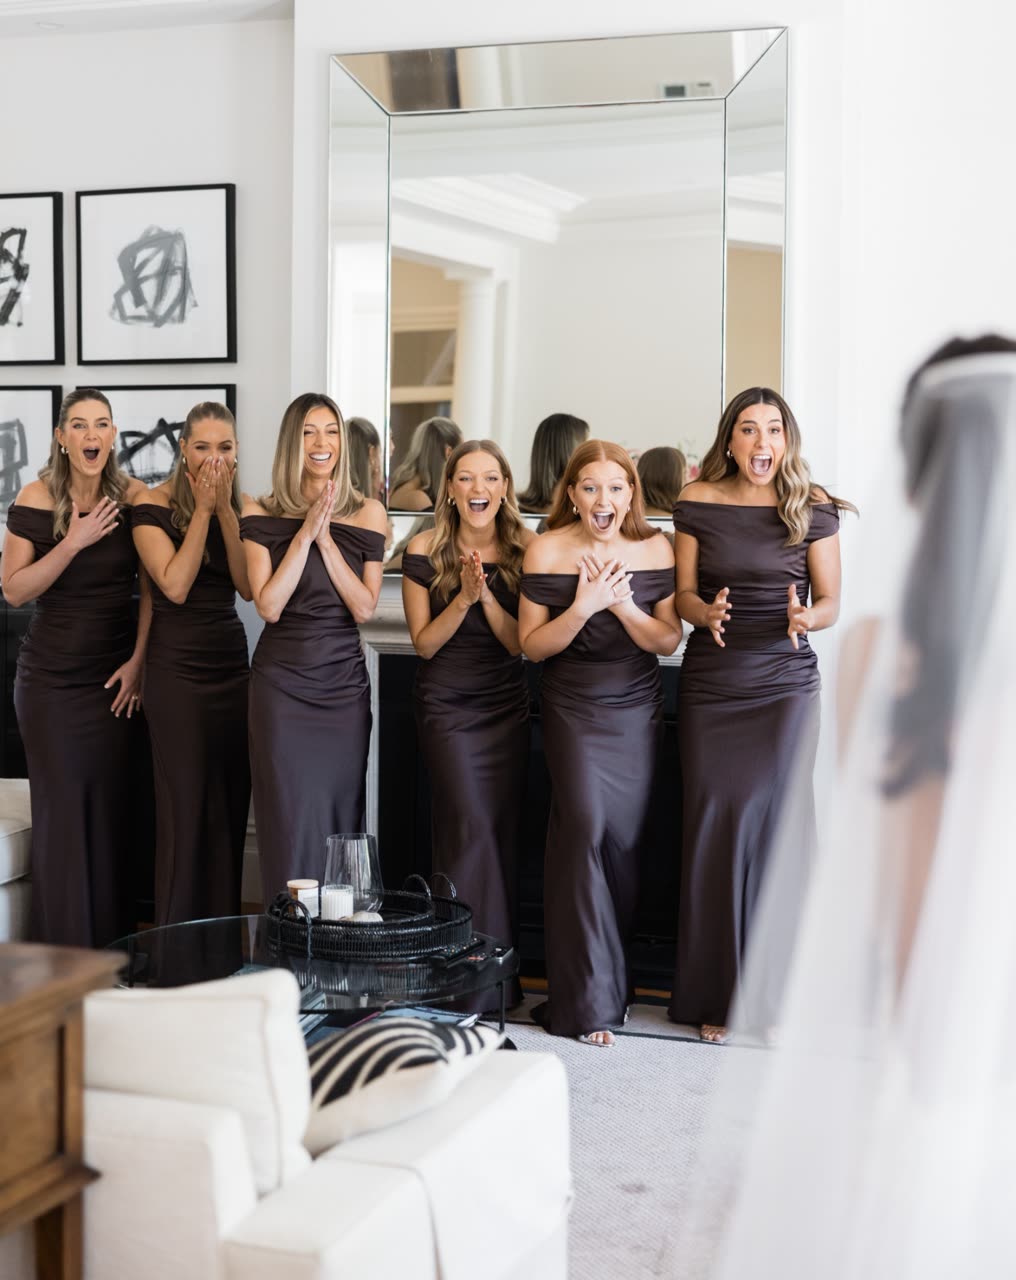
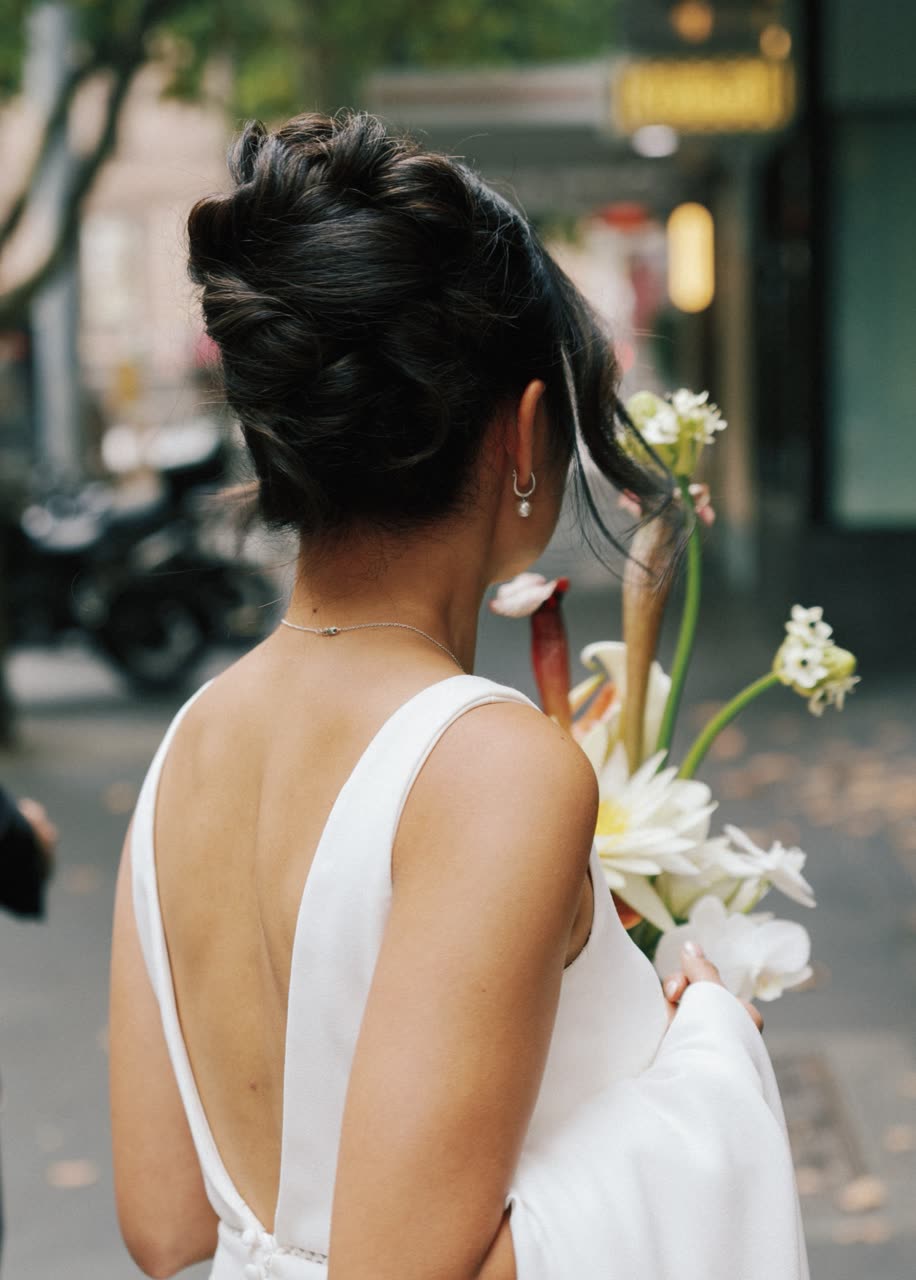
Every card is the live ad creative, embedded straight from the Meta account — including the carousel’s 10 looks.
The dashboard in operation
What the pipeline looks like today Live dashboard
A live read from the personal dashboard I built for Lia — leads, quoted pipeline, paid deposits and the automated nurture, all in one place.
Better analytics, better decisions
I built her a personal dashboard app
To make sharper calls, I designed and built Lia a personal dashboard app — just for her business, solo, with AI as the build partner. It pulls leads, bookings, payments and ad data into one place, runs the branded quotes/invoices and email journeys, and gives clean analytics. The next layer I’m building: AI agents that read the data, surface what’s working and what isn’t, and make every future decision data-driven — the AI-assisted workflow this role is about.
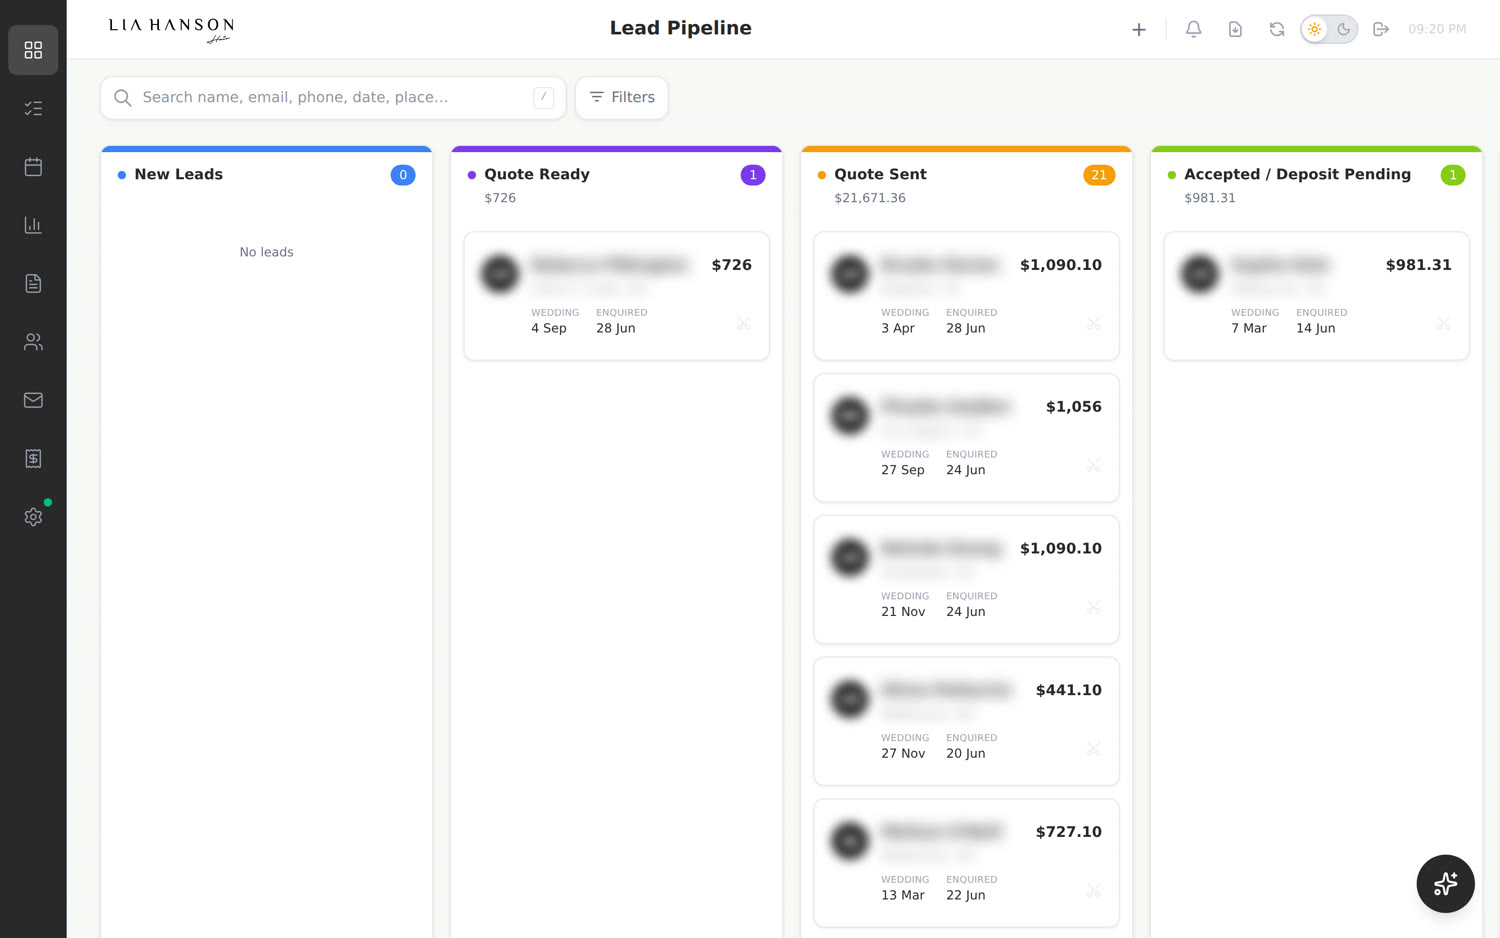
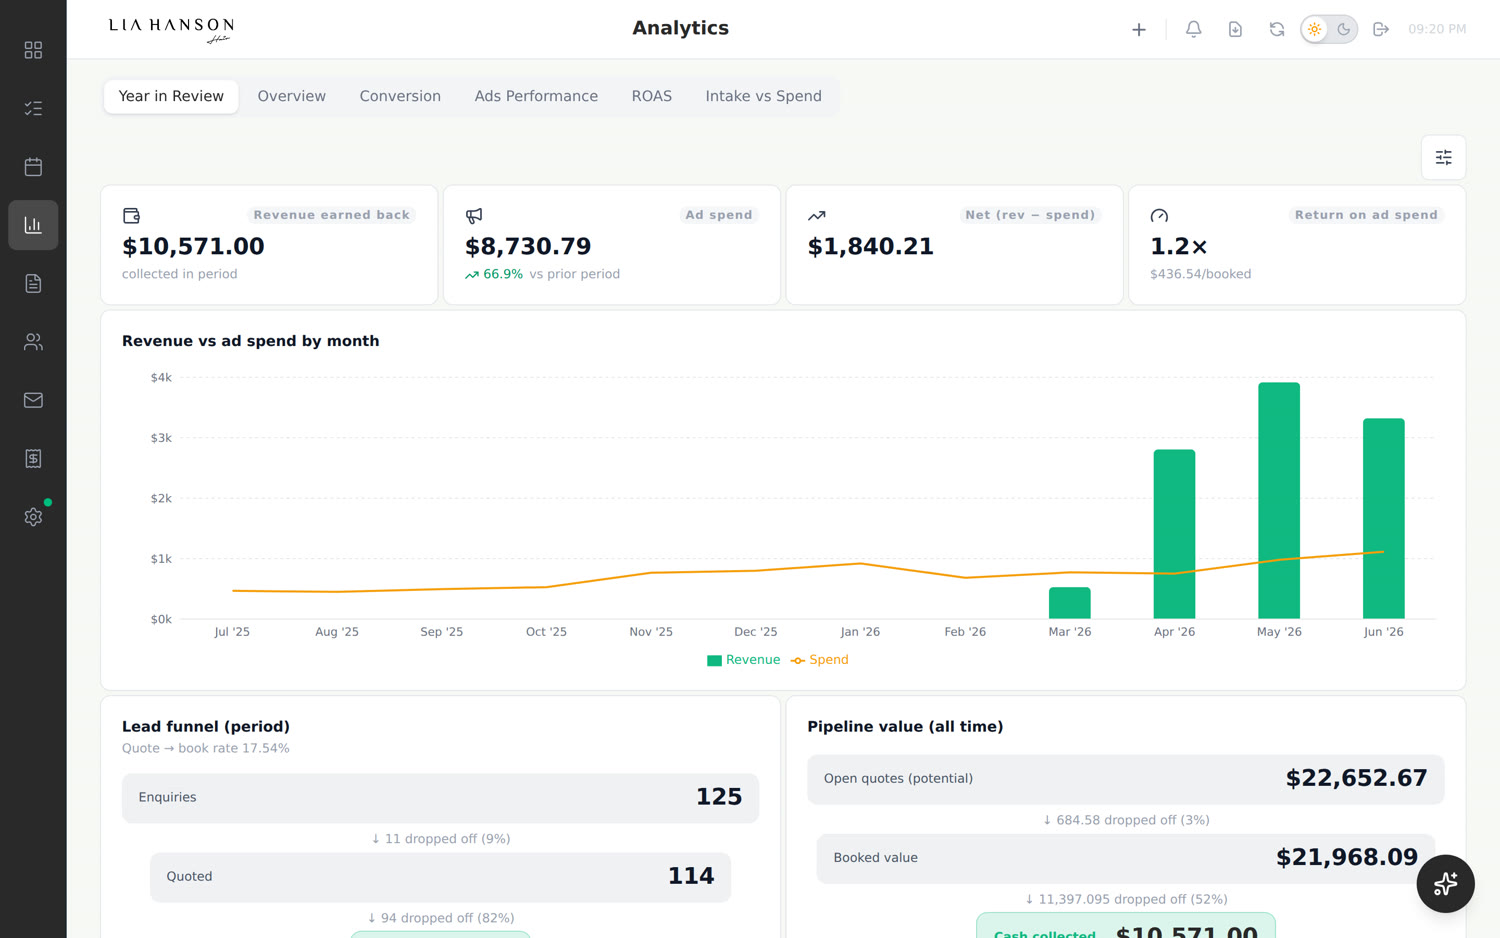
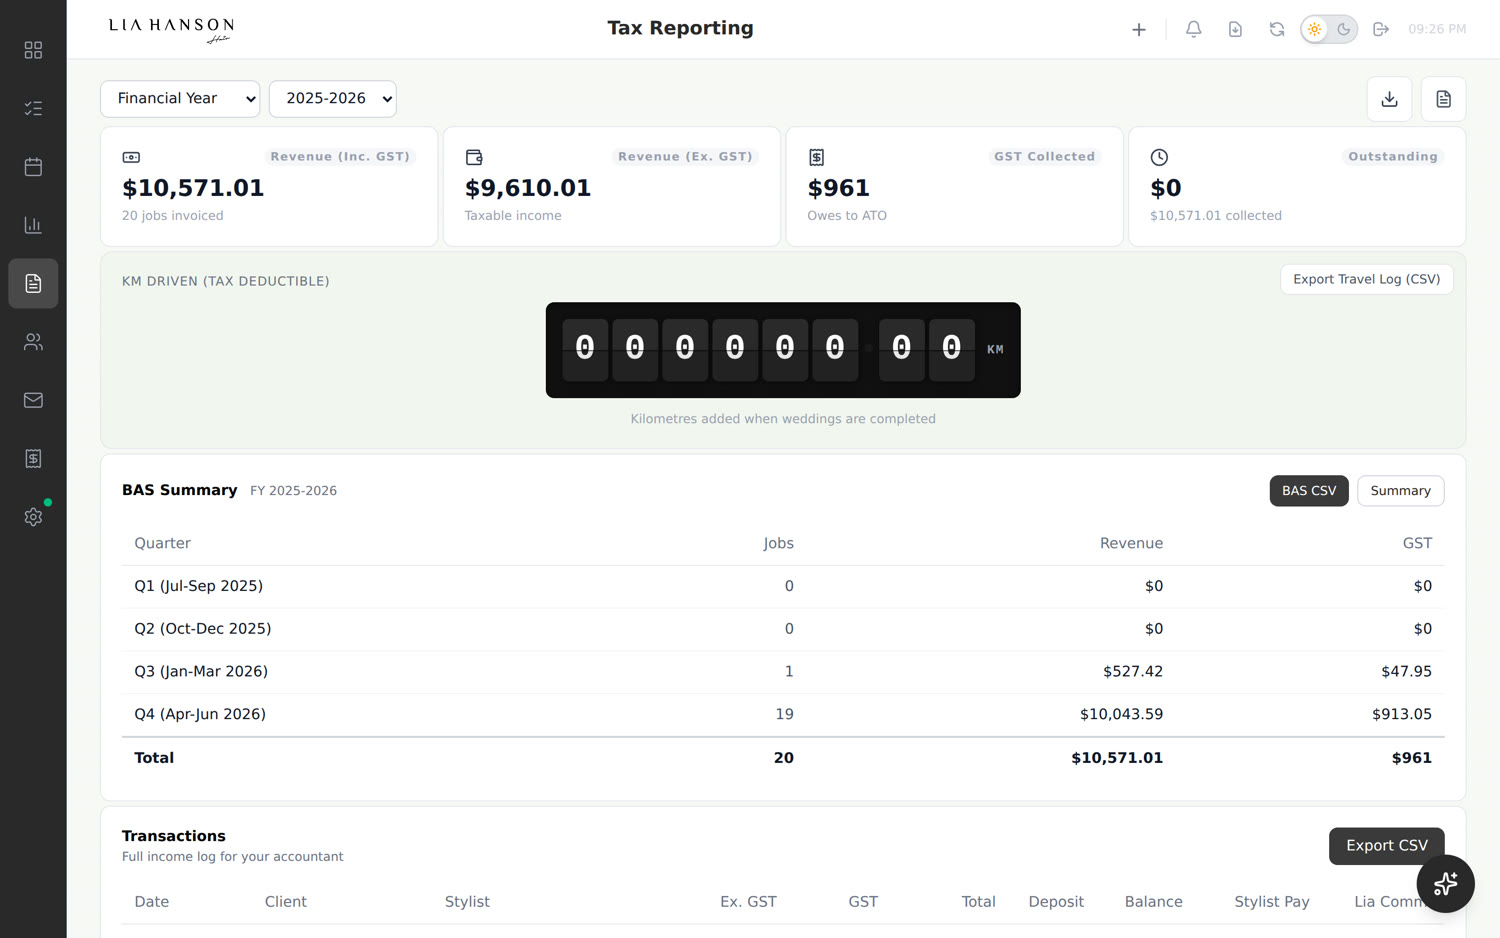
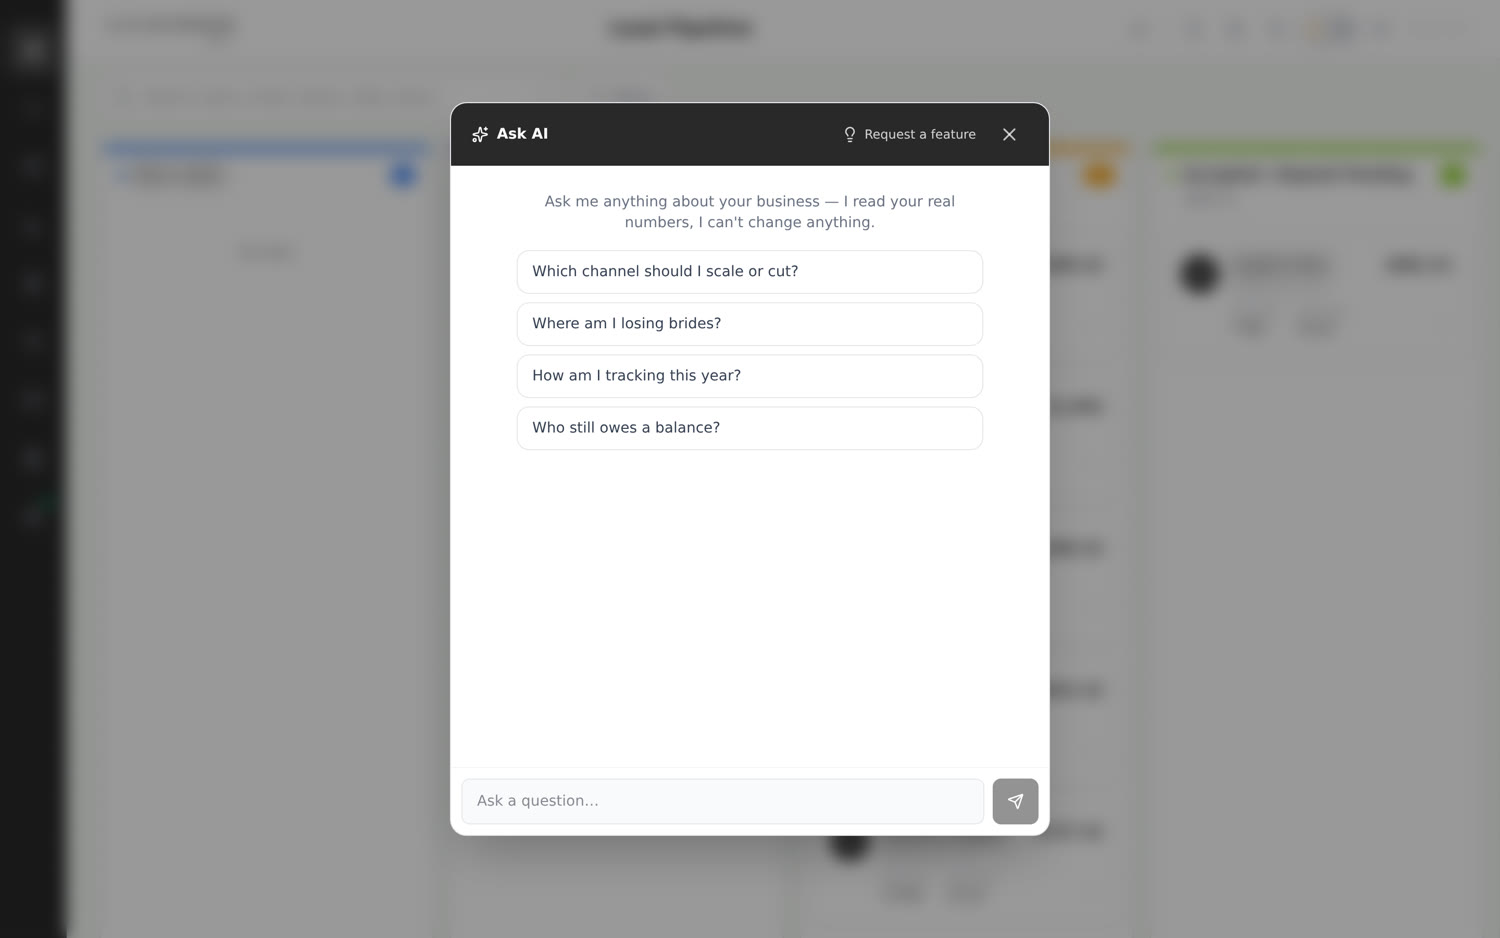
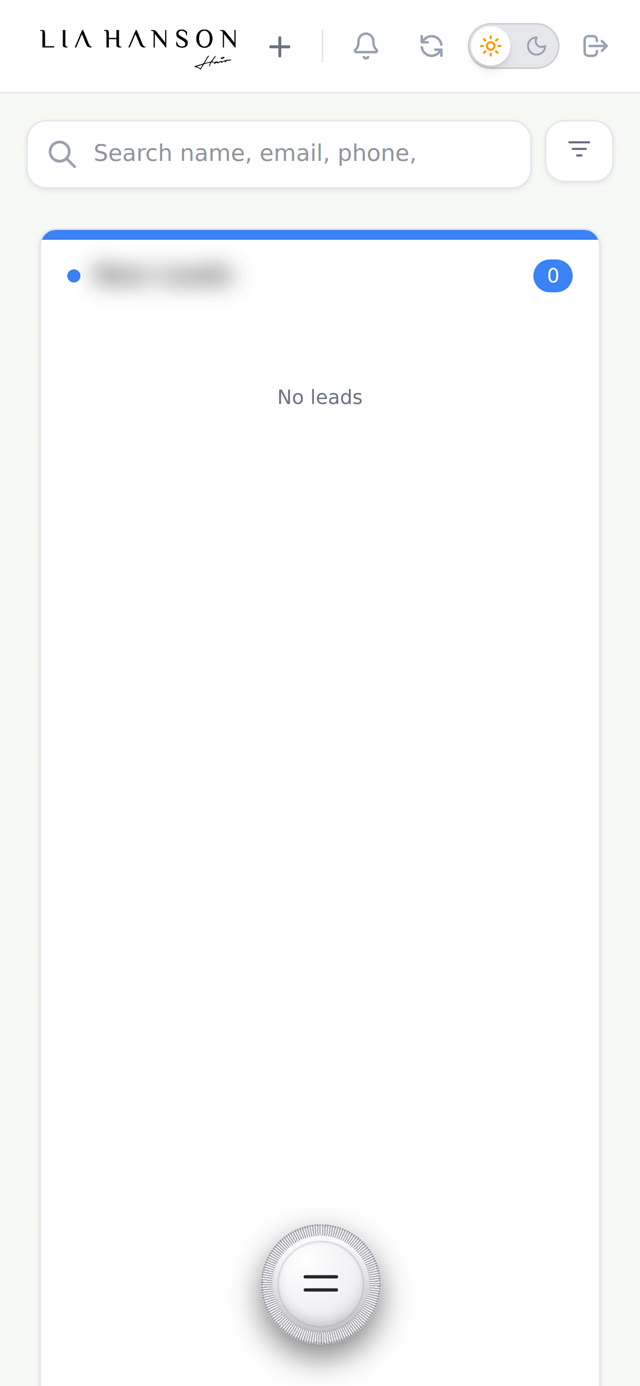
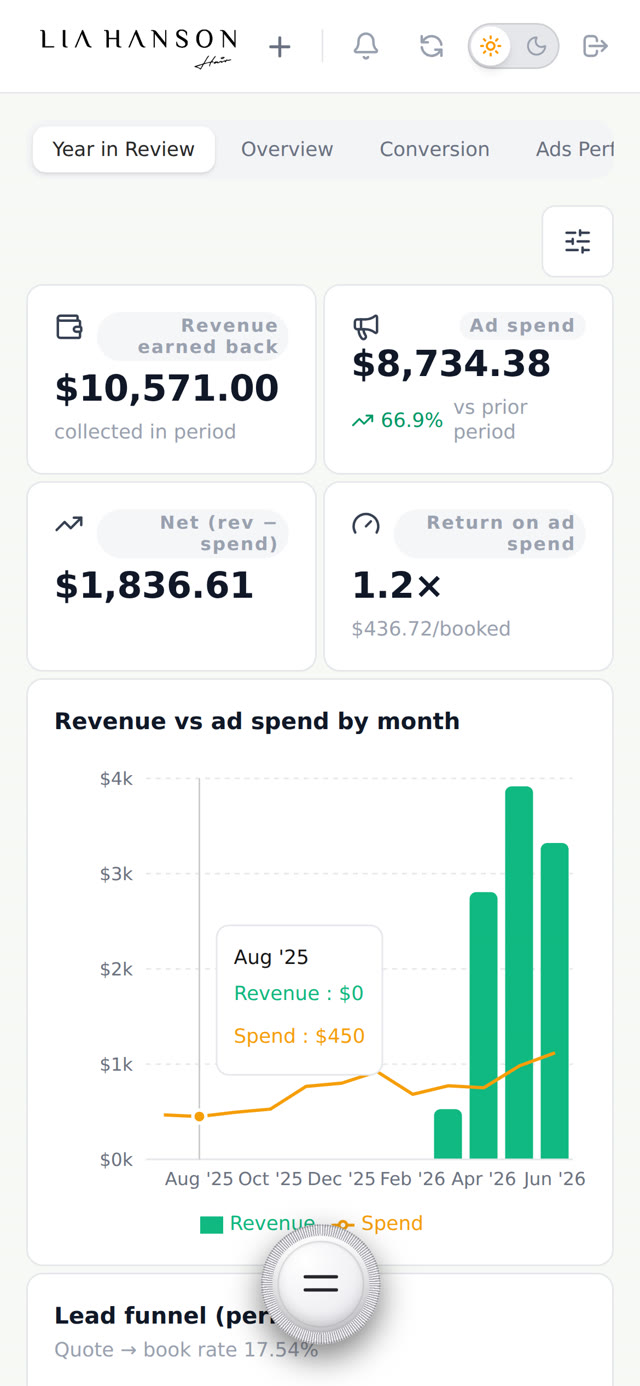

- One view of the business — leads, bookings, payments and ad data together
- Branded quoting/invoicing with hosted accept pages + automated email journeys
- Meta server-side conversion tracking (CAPI) + UTM-first attribution
- Ad-spend ROAS analytics — and AI insight agents (in build) that flag what to fix next
Stack: Next.js · React · TypeScript · Supabase · Tailwind. Screenshots are from the live app — client names blurred for privacy.
The honest scorecard
What’s working, what isn’t, and the plan
Growth isn’t a straight line. Here’s the candid read — and what I’m actively doing about the weak spots. Knowing exactly where it leaks is half the job.
Working well
- ↑ Top-of-funnel is cheap and strong — 4.5% CTR (~3.9× benchmark), $0.50 CPC, ~7× ROAS.
- ↑ Strong organic moat — a Google profile built from zero, SEO blogs, and 254 five-star reviews (90 Google · 164 Fresha).
- ↑ Revenue compounded — total business ~7×, weddings ~13× over four years.
The hard part
- ! Conversion is the bottleneck — only ~16% of leads reach a paid deposit; ~43% go cold first.
- ! Volume ≠ bookings — January 2026’s 50-lead spike didn’t convert proportionally.
- ! Lead quality varies — broad paid reach means qualifying harder matters more than raw volume.
What I’m doing about it
- → The dashboard’s AI agents analyse where leads stall and surface the “why”.
- → Sharper lead qualification + faster first response to warm enquiries.
- → Reworked nurture journeys and win-back offers; new conversion strategies in test now.
- → Deliberately prioritising the higher-ROI wedding engine; salon overflow now staffed on commission (2 stylists hired, a 3rd likely) while we build a bigger brand.